Insight Over Impulse
Mastering Mindset, Strategy, and Edge
Presented by Matae, Spacemonkey, JMoney & John
Hosted May 1, 2025 • 7:00 PM EST
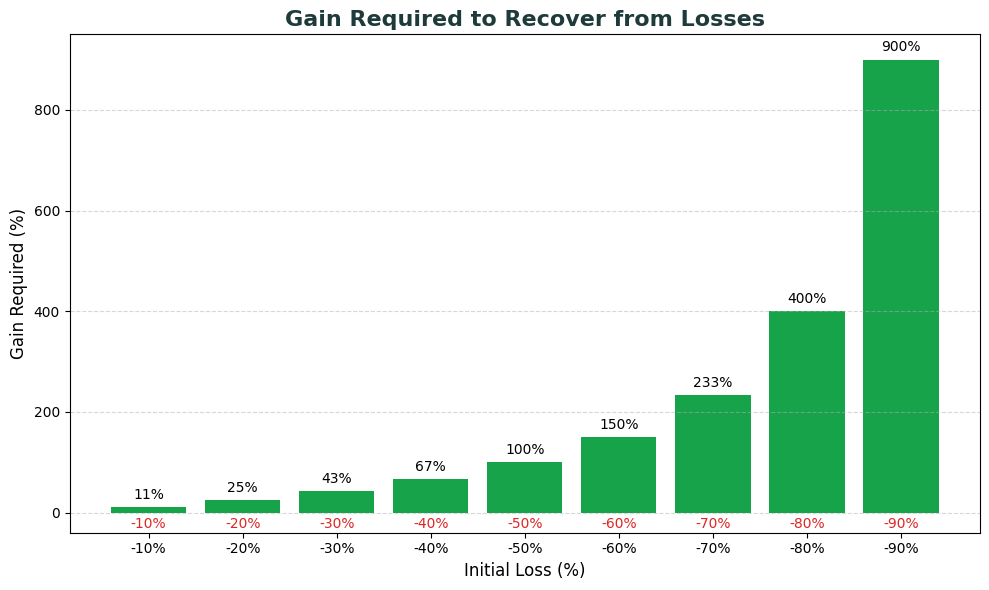
Why is it important to be able to grade trades?
"It's not whether you're right or wrong, but how much money you make when you're right and how much you lose when you're wrong."
The market has an unforgiving nature
Most of the money is made on the fewest number of opportunities
90% of gains come from 5% of days
Pushing when the odds are with you makes you as a trader
This is the cost of trading and what we are working toward everyday
Bet Sizing & Profitability
- Proper bet sizing is critical to long-term profitability
- Sizing up on high-probability trades maximizes returns
- Minimizing risk on low-probability trades preserves capital
- Your edge compounds over time with proper risk management
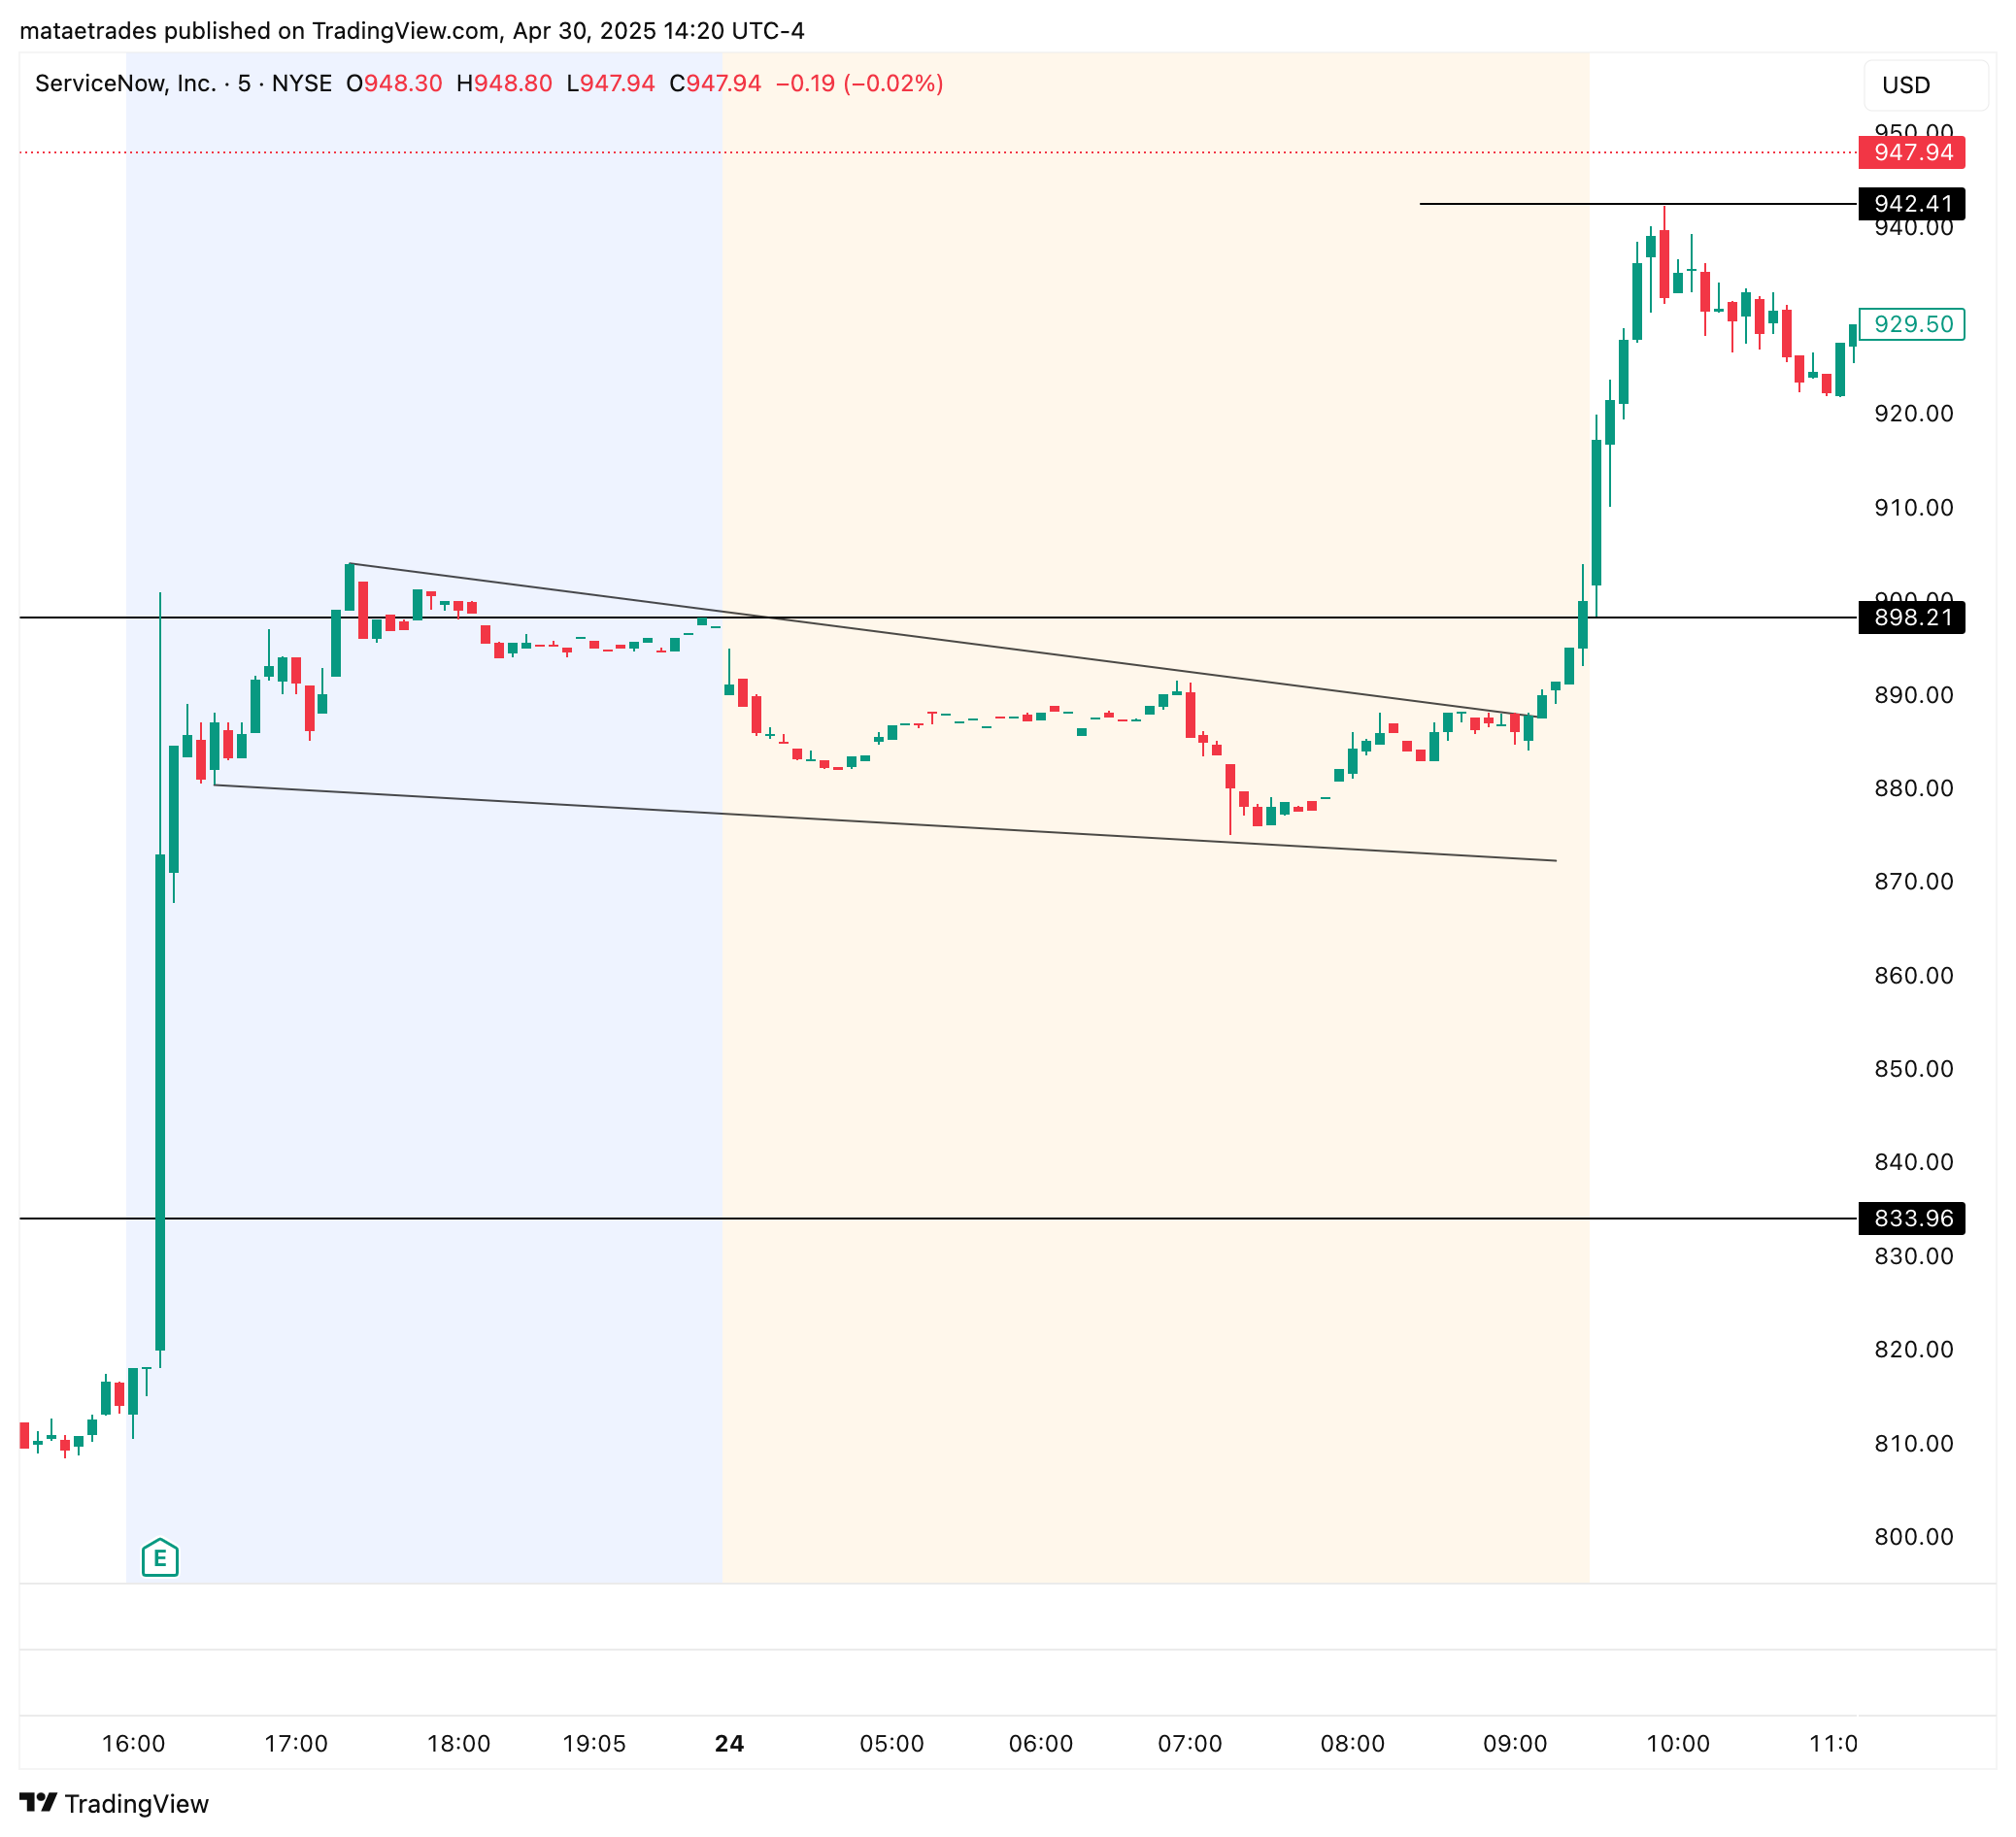
Example: Opening Drive Trade
Opening drive trade is when a stock has a catalyst, strong pre-market structure, and you take the immediate move higher or lower right at the open with momentum sell rules.
Key Components
- Catalyst present
- Strong pre-market structure
- Elevated RVOL
- RSI Divergence
- Defined exit strategy
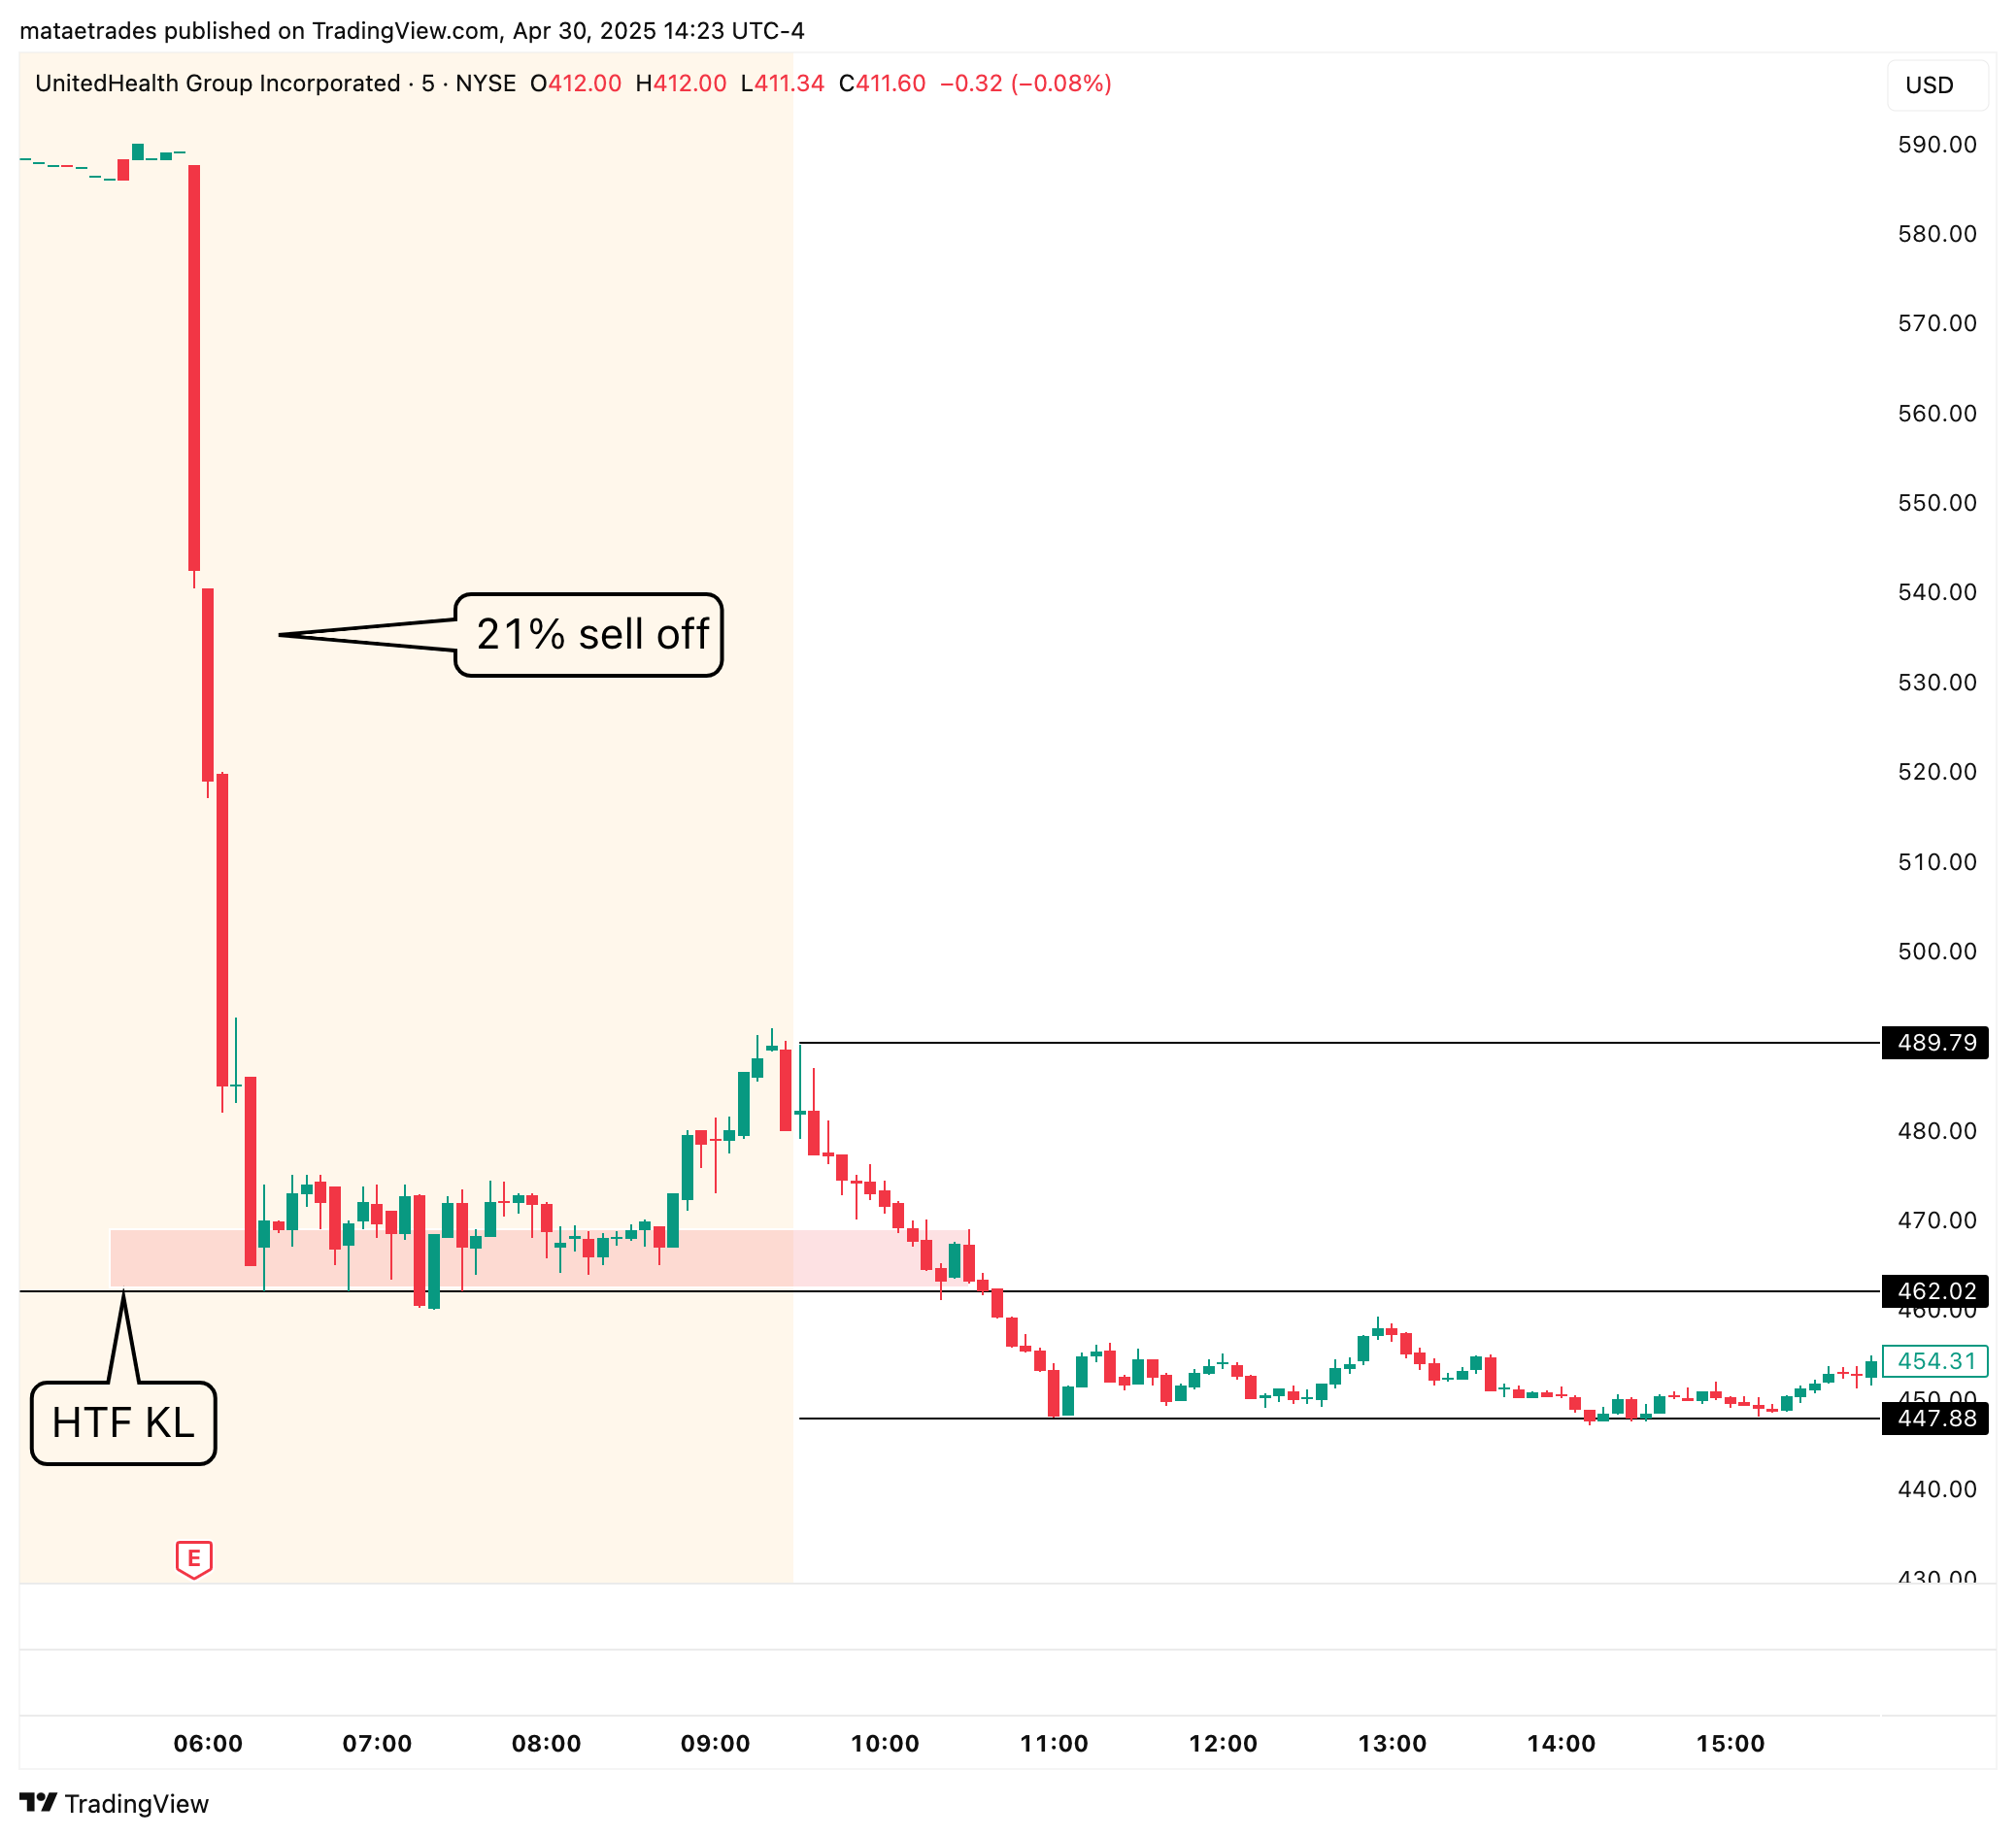
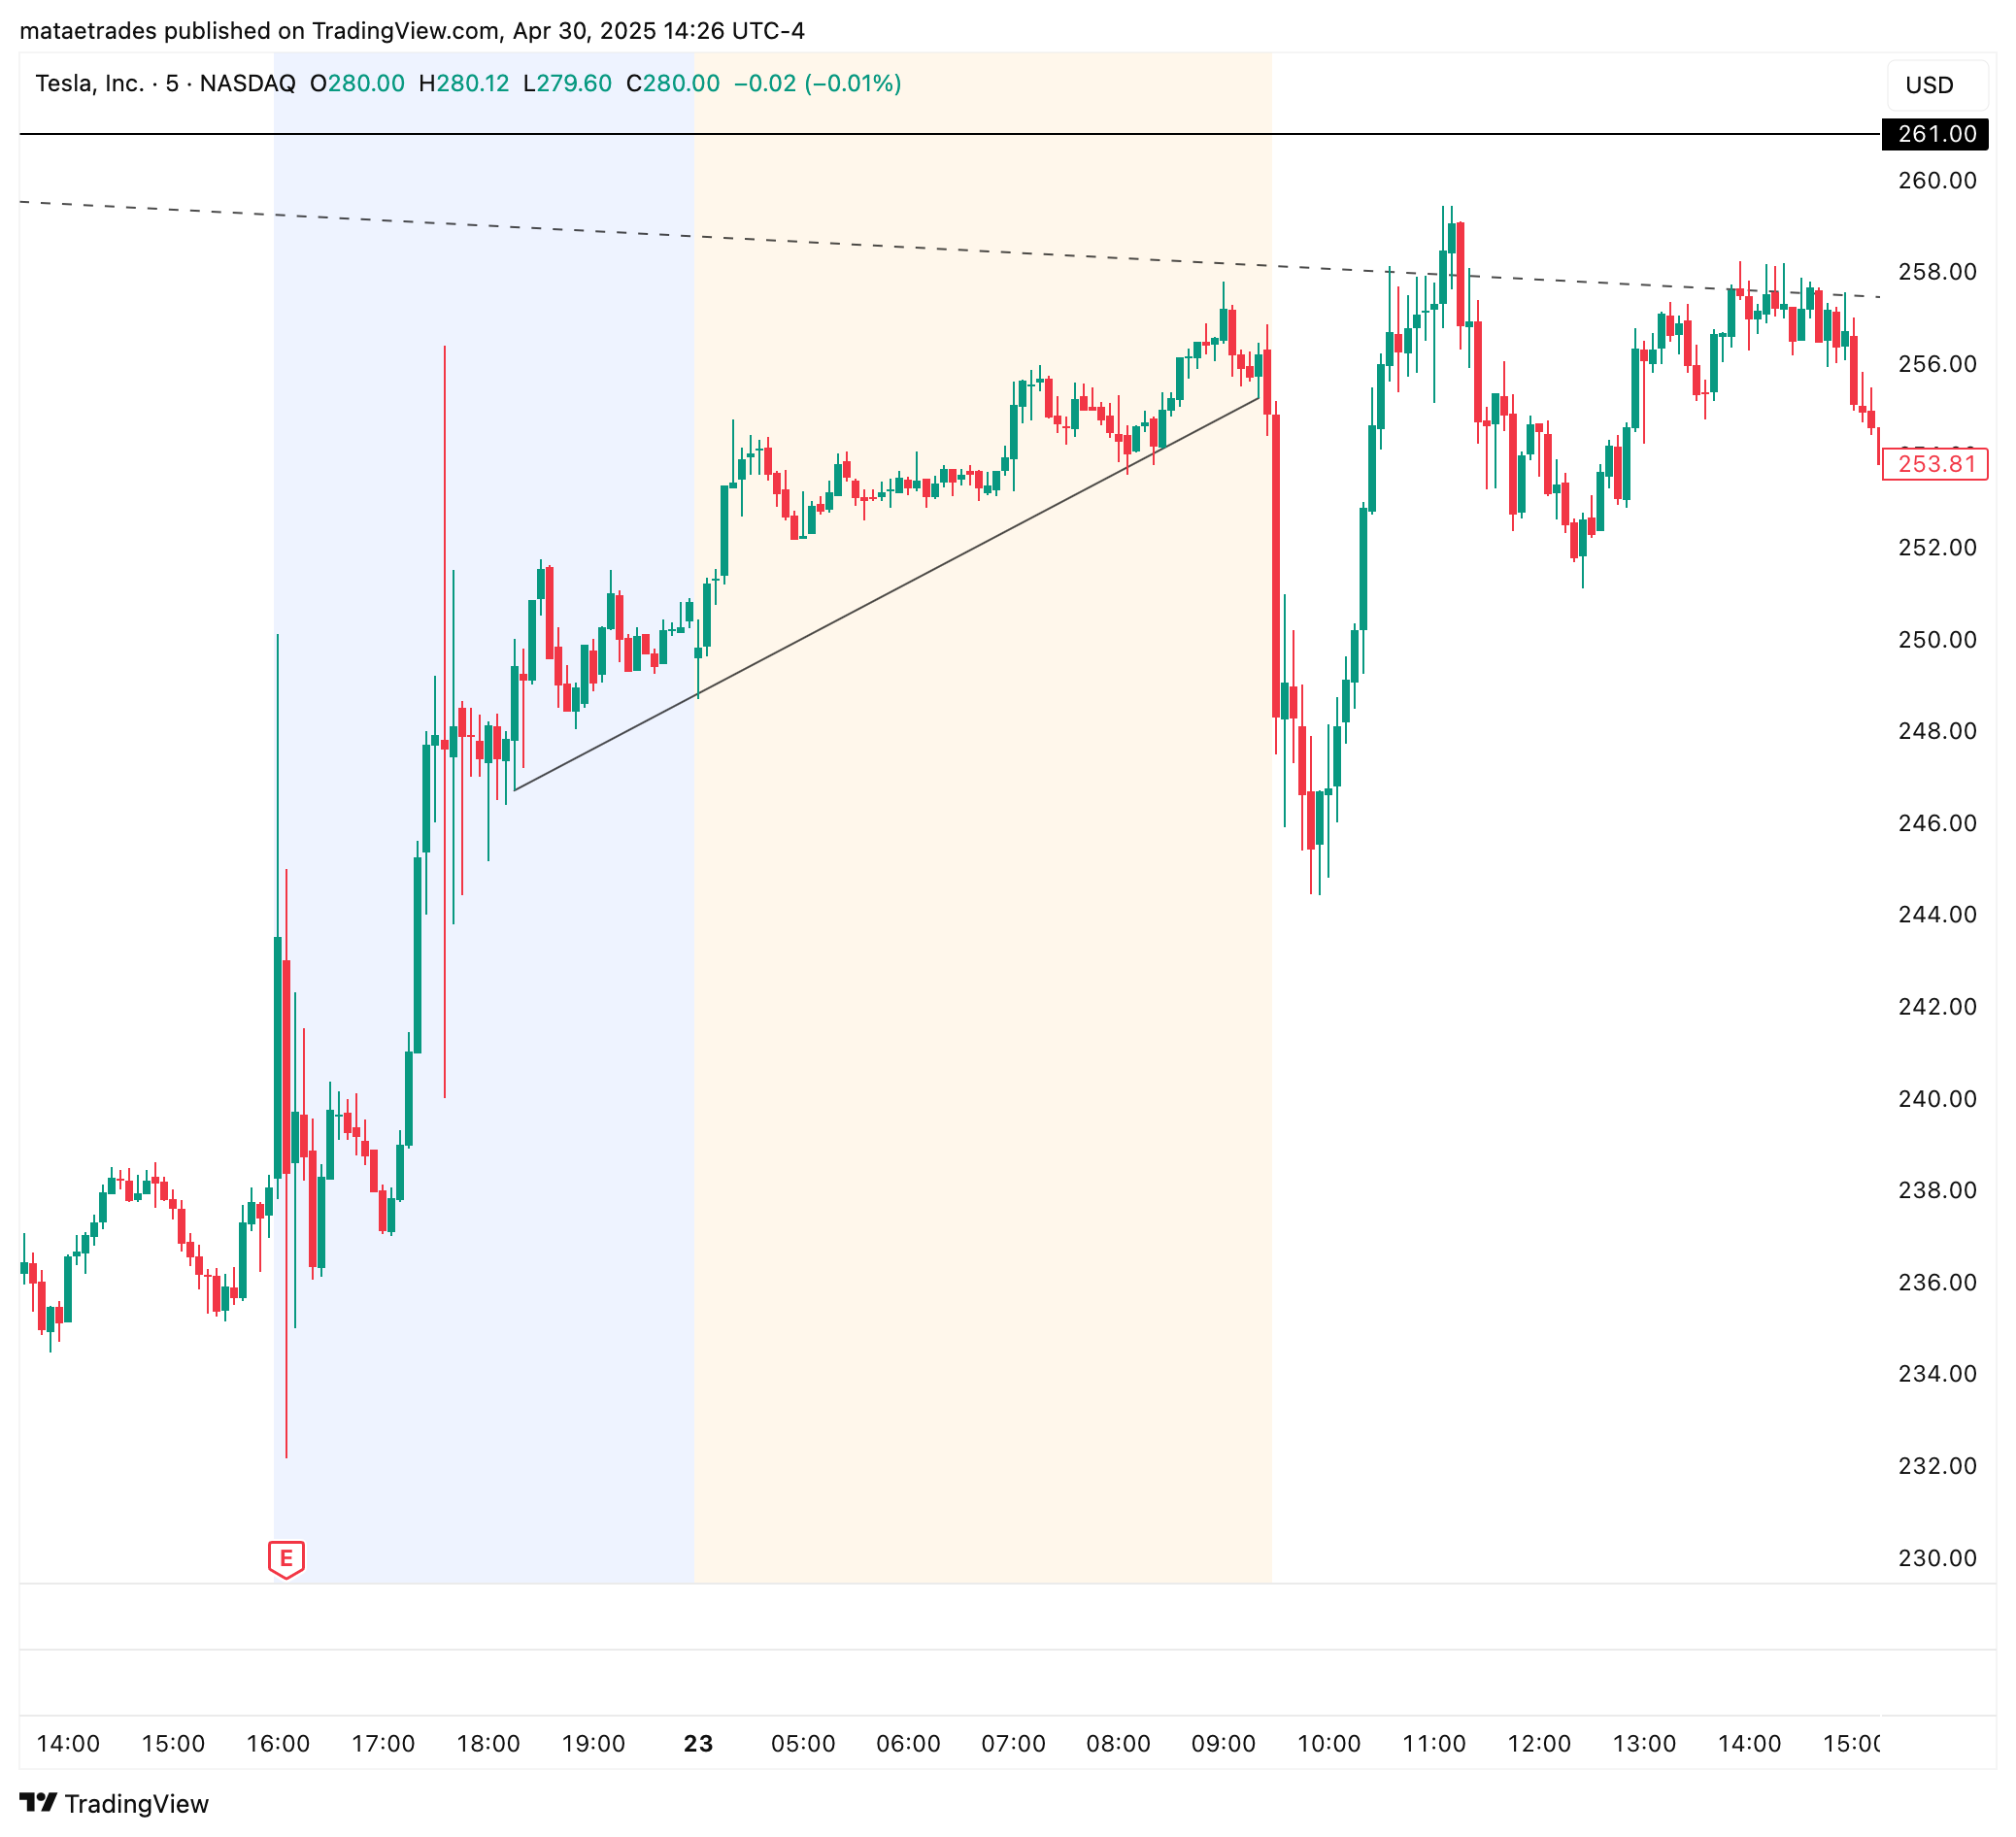
EX Trade Comparison: UNH vs TSLA Opening Drives
UNH - High Quality
- Quality catalyst
- Big weekly breakdown
- HTF / LTF confluence
- Significantly elevated RVOL
- Bearish RSI
TSLA - Low Quality
- Weak catalyst
- HTF choppy range
- Low RVOL
- Neutral RSI
- Poor risk/reward
Confidence is a key requirement to sizing up
You will never build enough confidence to consistently size up just by following another trader alone.
You must understand the dynamics of the setups that are presented and their expectations. This will allow you to confidently follow your sell rules and entries.
Reverse Engineer Success
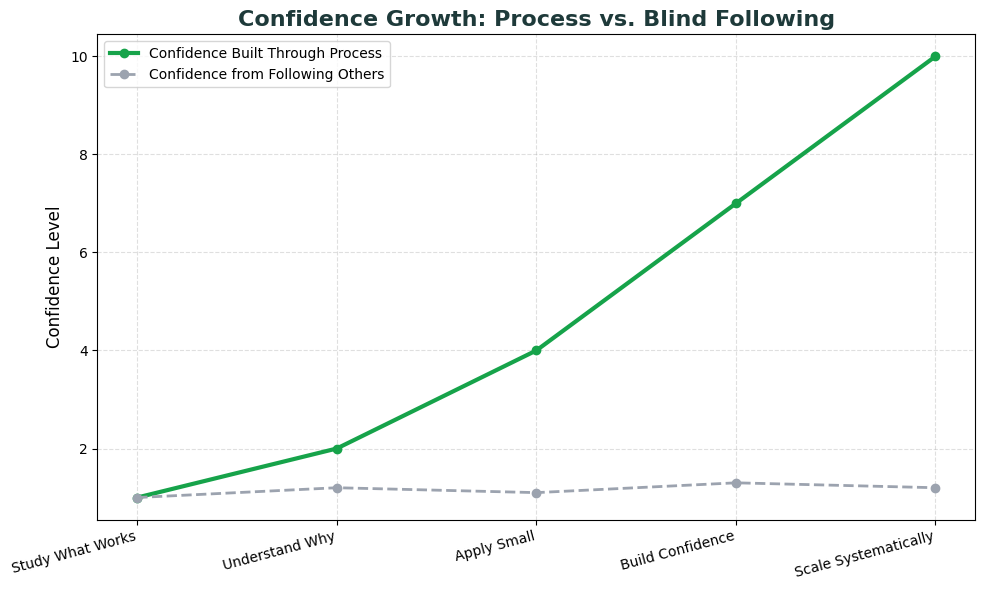
- Study what works
- Understand why it works
- Apply with small size first
- Build confidence through results
- Scale up systematically
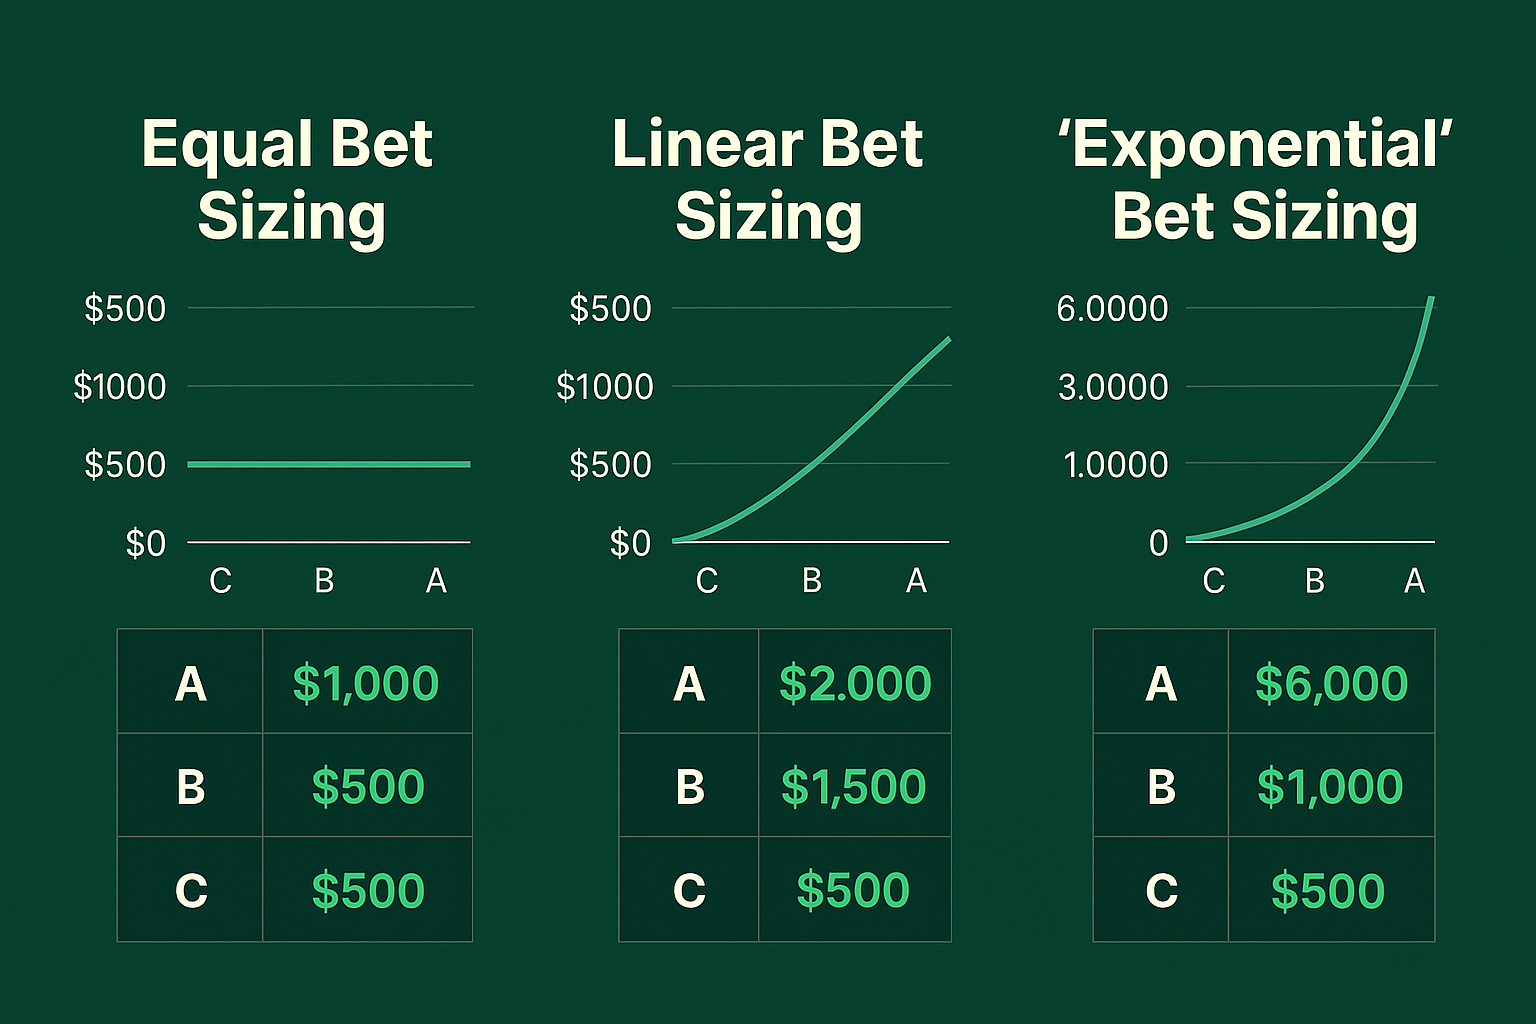
Linear vs. Exponential Growth
All the work we are putting in daily is to hit the big opportunities... not the fallacy most traders on social media push like a daily profit goal.
Linear Growth (Common Trap)
- Daily profit targets
- Same position size always
- Not accounting for fat tail risk
- Eventually levels out or fails
Exponential Growth (Goal)
- Size up on rare opportunities
- Daily work to identify key setups
- Proper risk management
- Compound returns over time
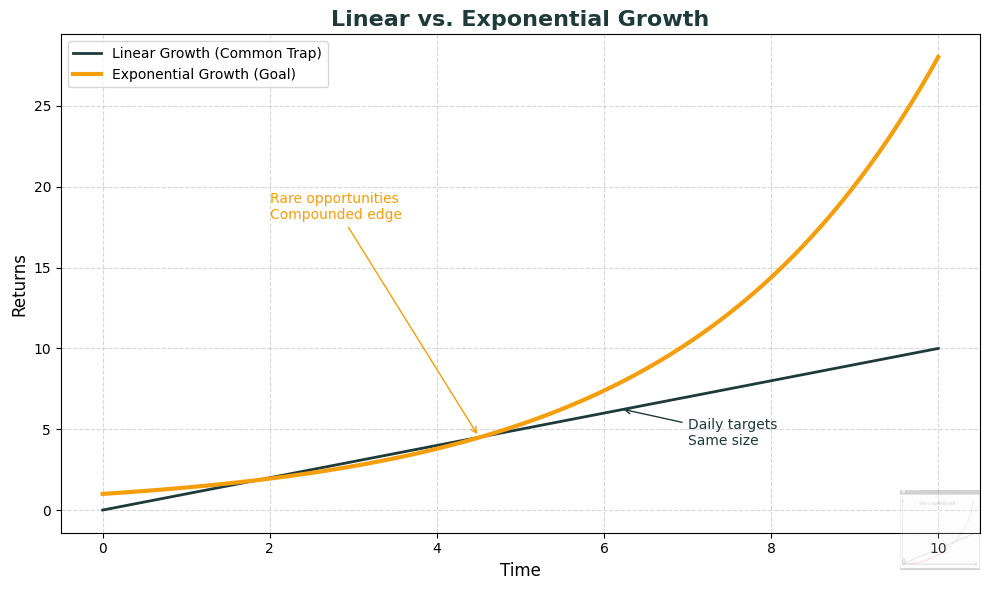
Theoretical Model
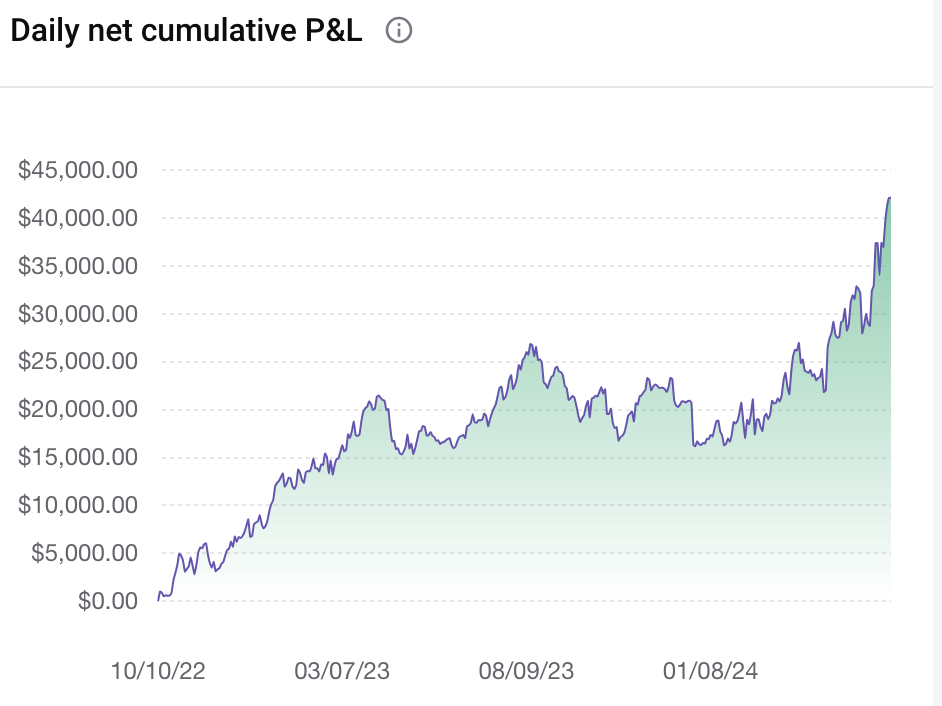
Actual Results
Reviewing your Trades and Data
Doing this daily will generate reports that help you see where performance is excelling or lacking
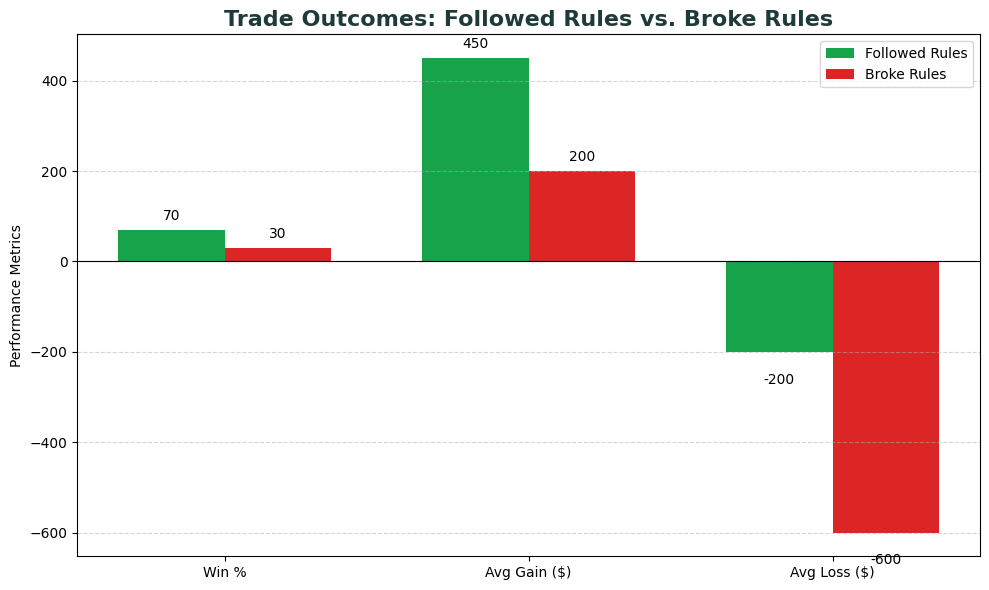
Trade Outcomes
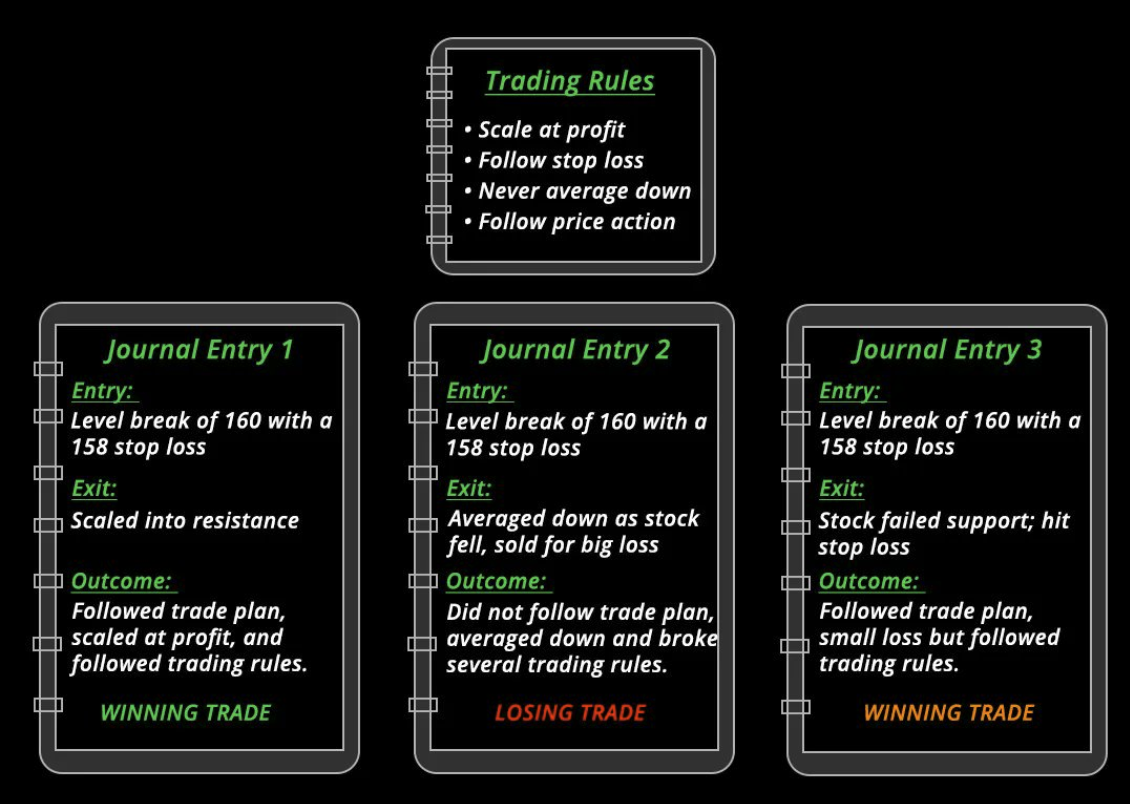
Trading Journal
Become the Analyst of Your Trading Business
- Identify patterns in wins and losses
- Pinpoint your strengths and weaknesses
- Recognize emotional triggers
- Track improvement over time
- Make data-driven decisions
Failed Breakdown
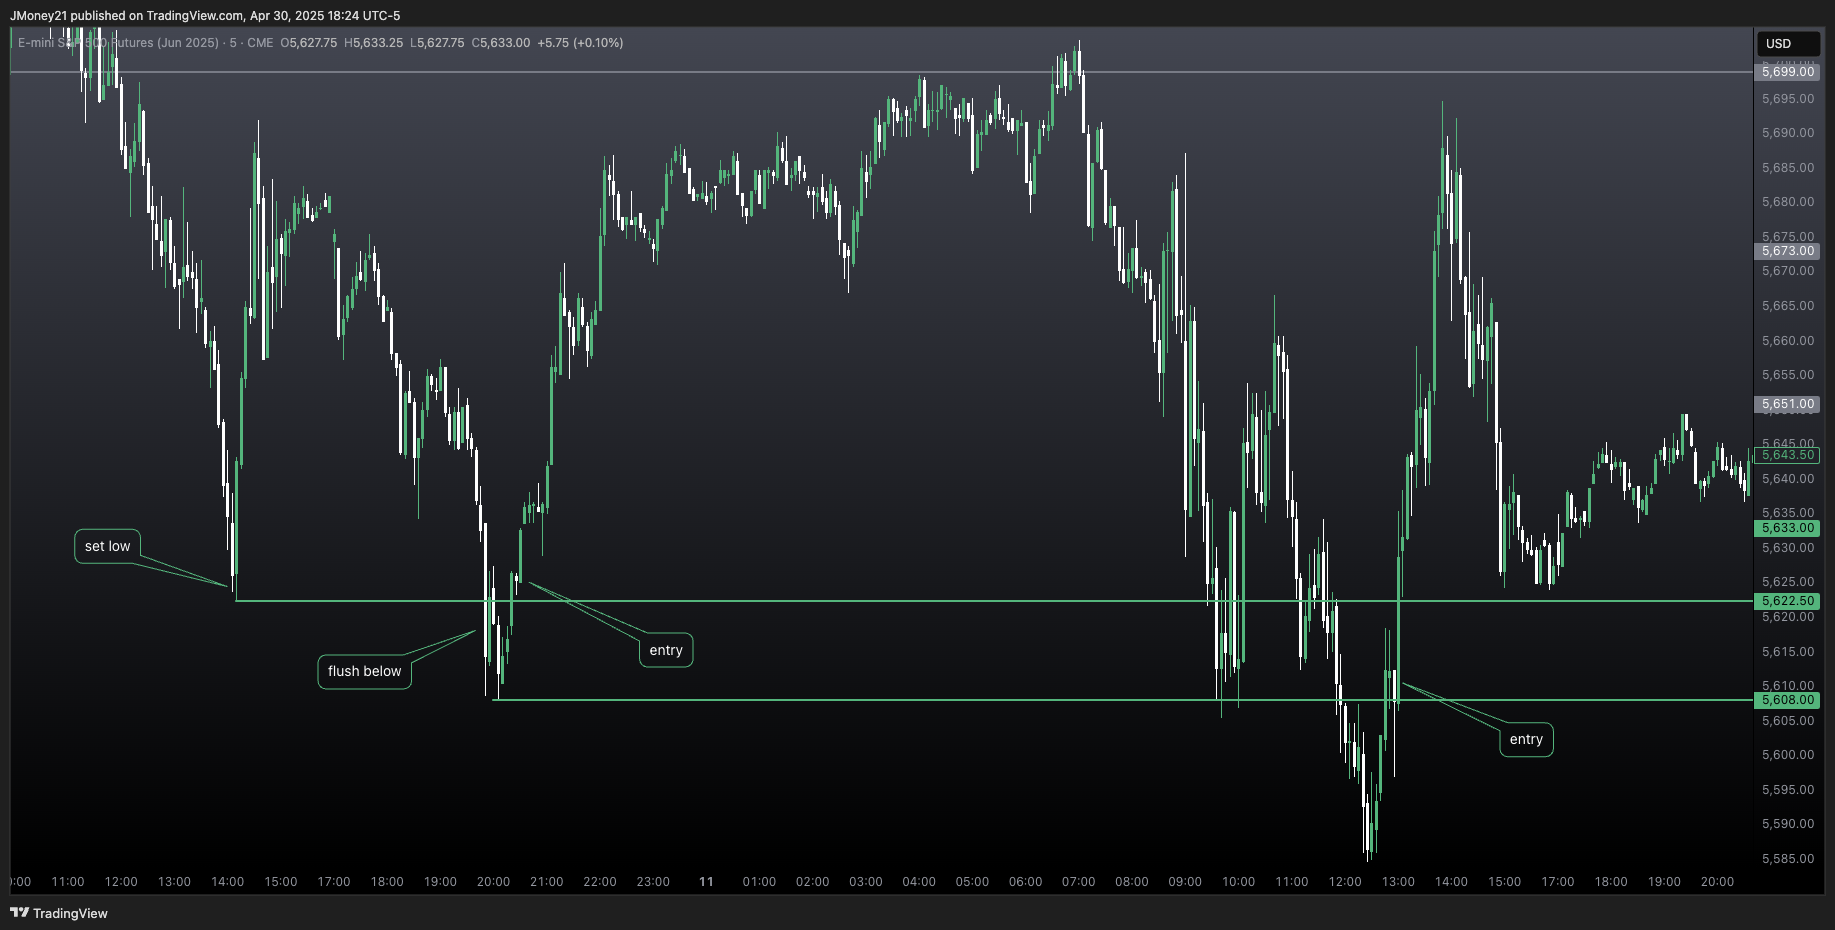
Key Characteristics
- Price breaks below a prior low
- Quickly reverses and reclaims the level
- Often accompanied by high volume on the reversal
- Previous support now becomes resistance
- Strong indicator of trend reversal
Failed breakdowns often lead to powerful moves in the opposite direction
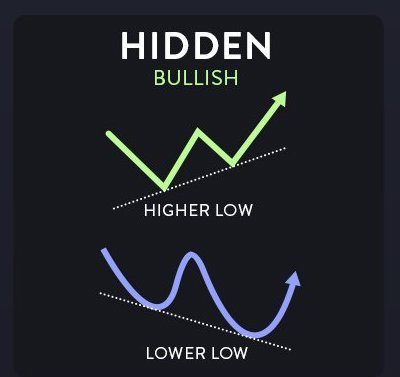
RSI Hidden Divergence
Hidden divergence occurs when RSI makes a new high/low but price does not confirm with its own new high/low.
Bullish Hidden Divergence
- Price makes a higher low
- RSI makes a lower low
- Indicates energy available for upside
- Signals potential upward continuation
- Confirms strength in existing uptrend
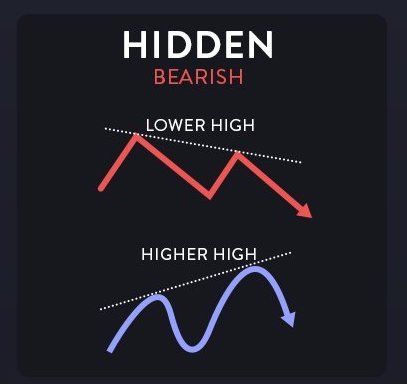
Bearish Hidden Divergence
- Price makes a lower high
- RSI makes a higher high
- Indicates potential downward reversal
- Confirms weakness in current price action
- Often signals continuation of downtrend
Earnings Reversals
How I Trade It
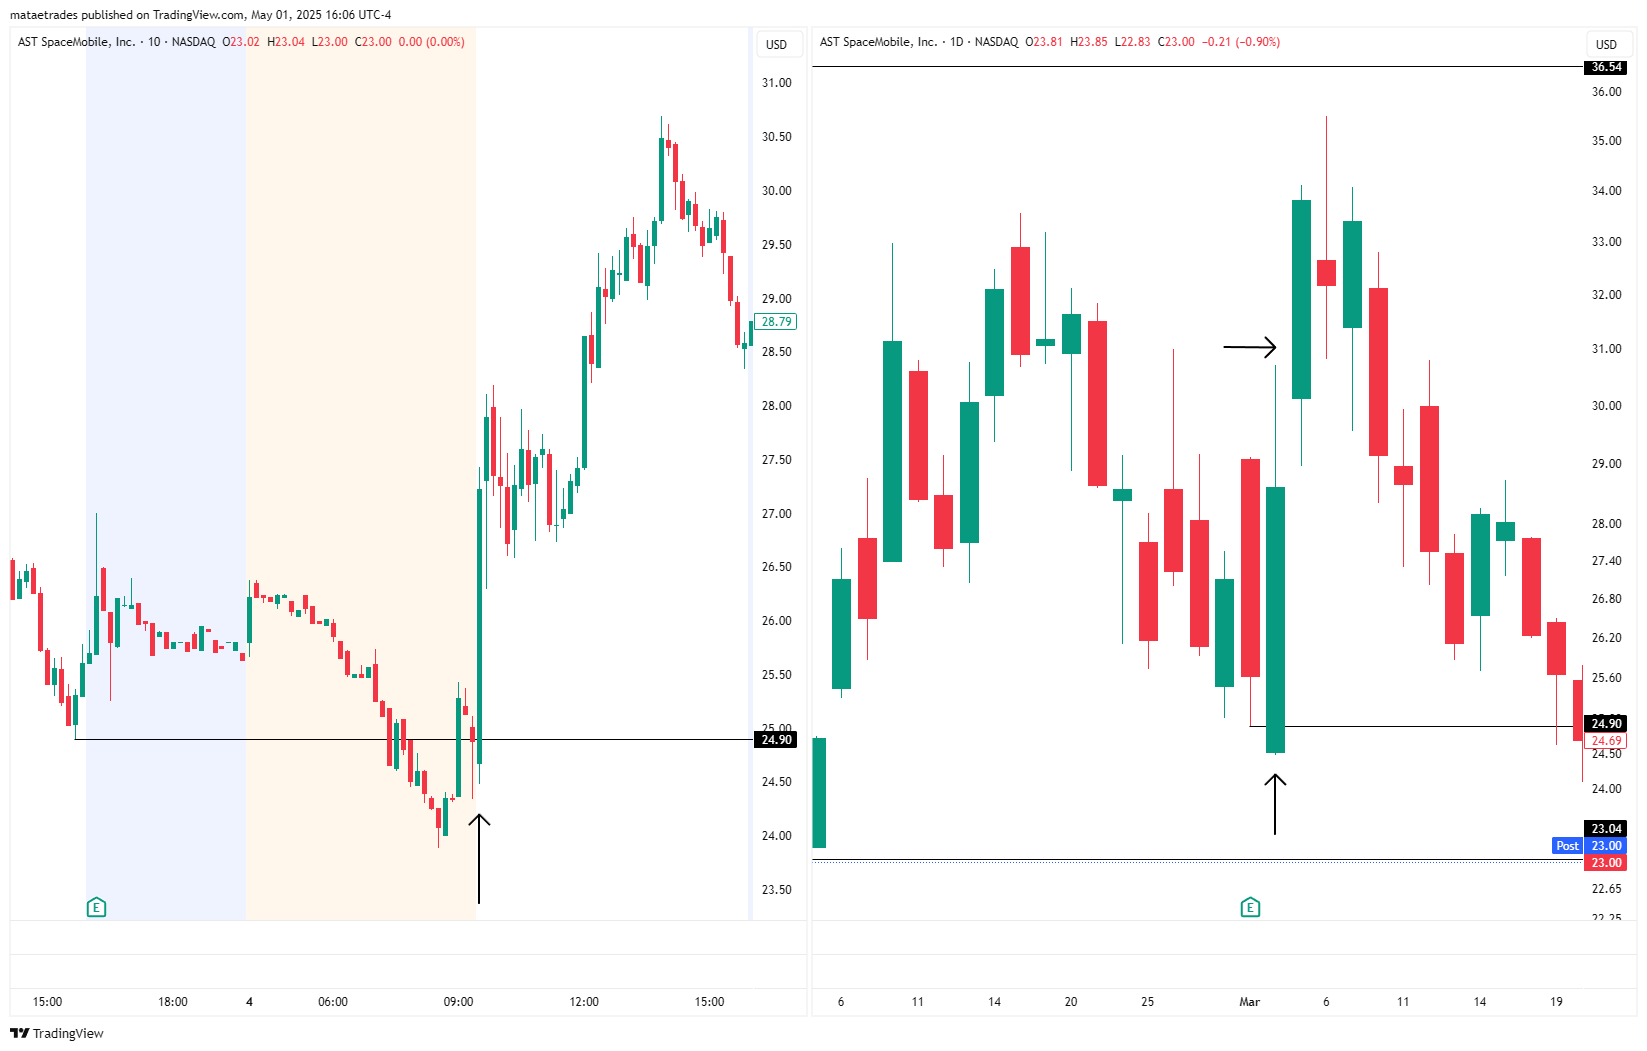
Earnings gap downs can become strong reversal opportunities. If a stock gaps down between 1% - 5% and buyers step in fast, closing near the highs, it can fuel a multi-day move as shorts cover and momentum builds.
Things To Look For
- 1% - 5% gap down
- Aggressive buyers stepping in
- Red to green move (preferred)
- A close near the highs
- Watch for continuation day after
Example: ASTS Earnings Reversal
Ready to Trade With Insight?
Special pricing available for ONLY 72 HOURS after this webinar!
Contact: john@tradewithinsight.com